Try as you might, some of you can’t help but read my blog. Perhaps it’s like a horrible highway accident; you just can’t avert your eyes. You regular readers know, then, that my mind favors images, graphs, and pictorial displays, and that’s what I’ve got going on today.
It isn’t that I disdain text; I am a writer, after all. It’s just that a picture is worth a thousand words, so when I need information in a condensed form, it’s hard to beat a graphical chart.
When a writer sets out to craft a story, it can be difficult to keep all the characters in mind. One technique for doing so is to use a Character Relationship Map (CRM). Like a mind map and Root Cause Analysis motivation chart, this map is something for your use alone. No reader will see it, so you can make up your own format.
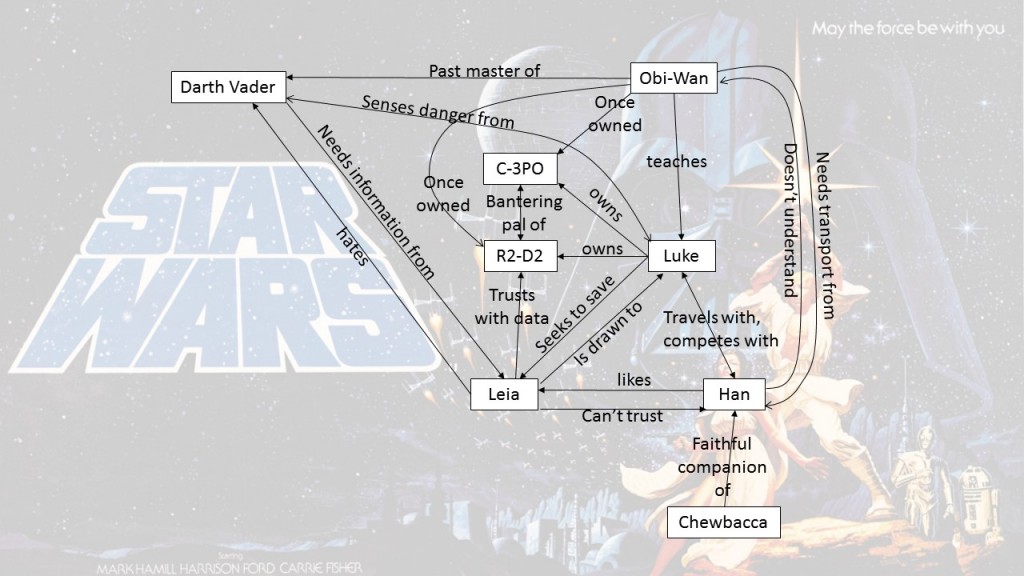
 The one I’m showing here, for the first Star Wars movie, A New Hope (Episode IV), is for illustrative purposes only and is not complete or necessarily accurate. My only intent is to show one possible example for a case familiar to most readers. To see many other sample Character Relationship Maps, do an Internet search for that term and click on images.
The CRM depicts, on a single page, all the relationships between all your story’s characters, or at least the major ones. Having this map before you as you write the story will help you keep these relationships in mind. Note that your story must contain written evidence of each relationship. If not, the reader will not know the relationship exists.
Another advantage of a Character Relationship Map is to ensure you create and understand the relationships yourself. Each major character should have some arrows going out and some going in. Each major character should have arrows connecting to all other major characters.
You might think a CRM would be useful only for novels, or other stories with plenty of characters. However, such maps can be helpful even for short stories with as few as two characters. As I mentioned in an earlier blog, you could connect two characters with four relationships using four lines. Use one line to depict how Character A feels about Character B internally, another line to show how A behaves toward B externally, and two more lines to represent the internal feelings and external behavior of B toward A.
Relationships can be complex. A good author shows some amount of friction, or at least tension, between even the friendliest or most loving characters. Why? Conflict is central to fiction. No two characters are alike, so they will think differently and there will be some level of uncertainty, some speck of doubt or occasional distaste even between the closest and most devoted characters.
To make your CRM more beneficial to you, consider using colors and line thicknesses or shapes to represent other aspects of characters and relationships. For example, you could use box colors to represent character gender, where they stand on the good-evil spectrum, or some other attribute. You could use line thickness to indicate the intensity of the relationship. You could use line shape to indicate the type of relationship, perhaps curved lines for friendship and jagged lines for enmity.
Characters, and their relationships, change through the story. You could show that by means of two maps, one showing the before state, and the other the after state. Or you could find some method of picturing the change on a single map.
Have you used a Character Relationship Map? If so, did you find it helpful? Leave a comment for a rather colorful character known as—
Poseidon’s Scribe


