Is it possible to depict all story plots in graphical form? If you could, would you find some graph shapes more common than others? The late author Kurt Vonnegut thought so.
In 2004, he gave a lecture describing his system and that talk is so good, you ought to watch the video, at least the part starting at minute 38. He’s entertaining. Someone has animated Vonnegut’s graphs at this delightful website.
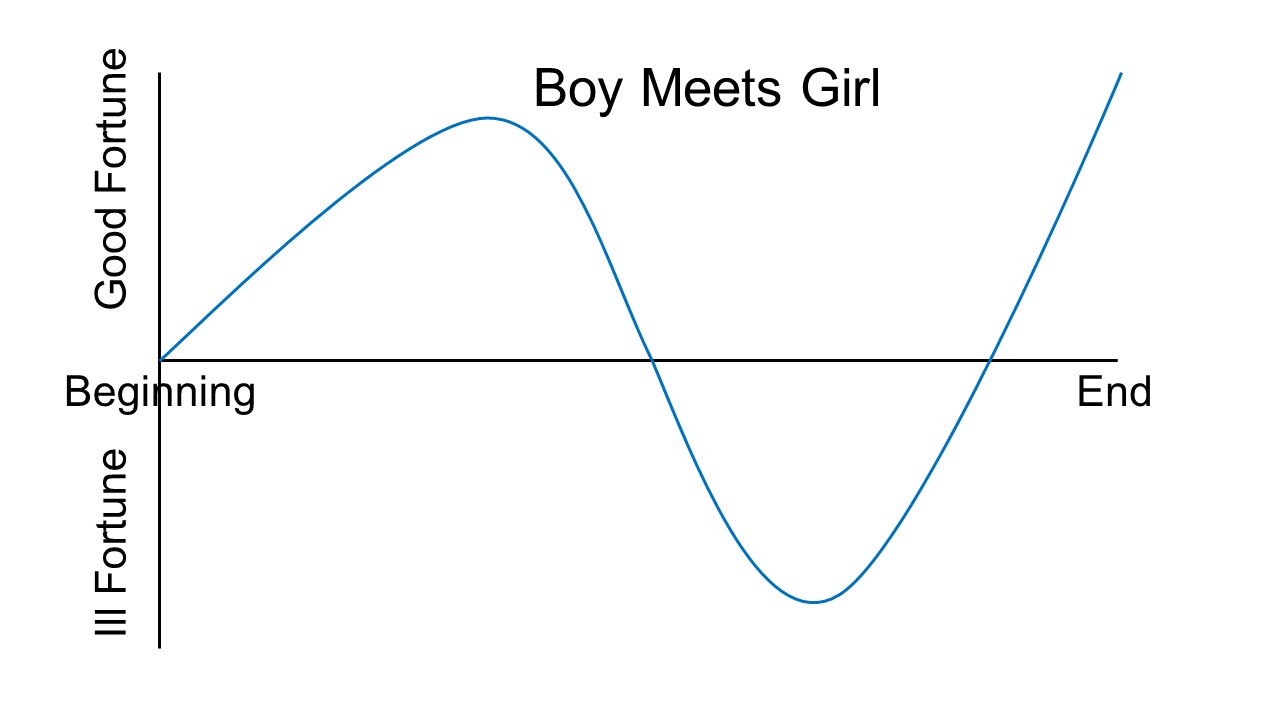
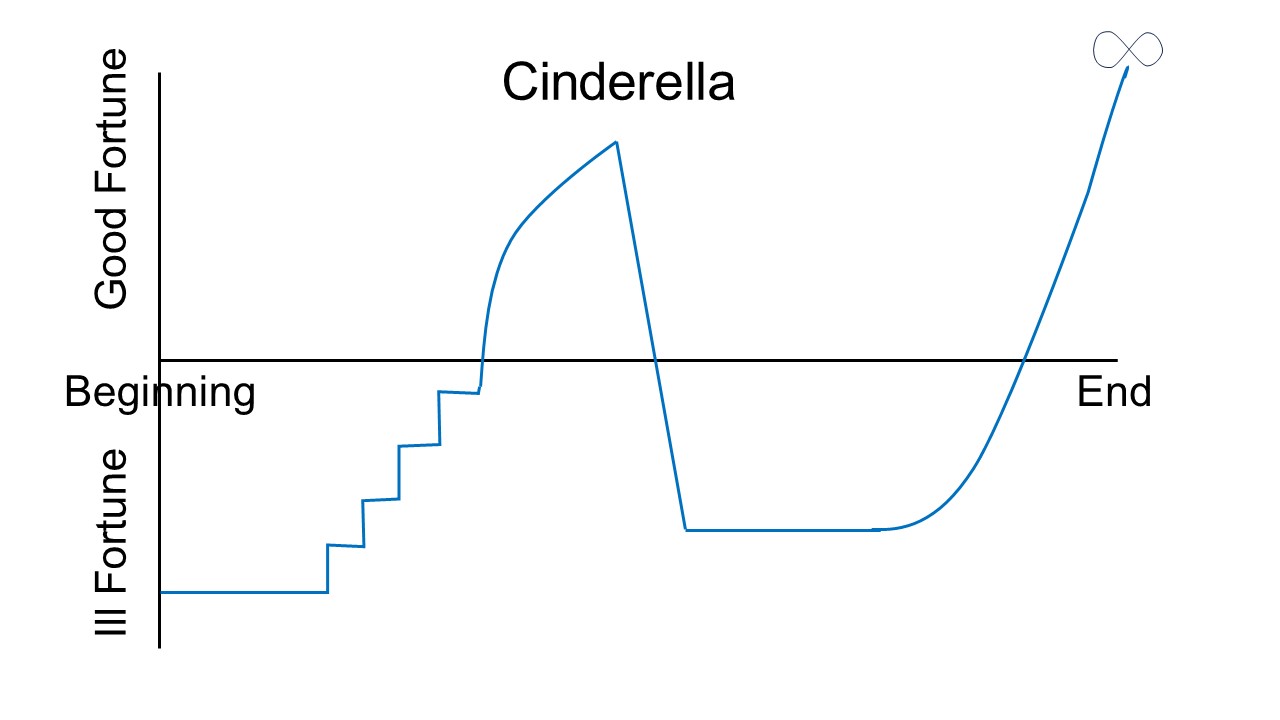
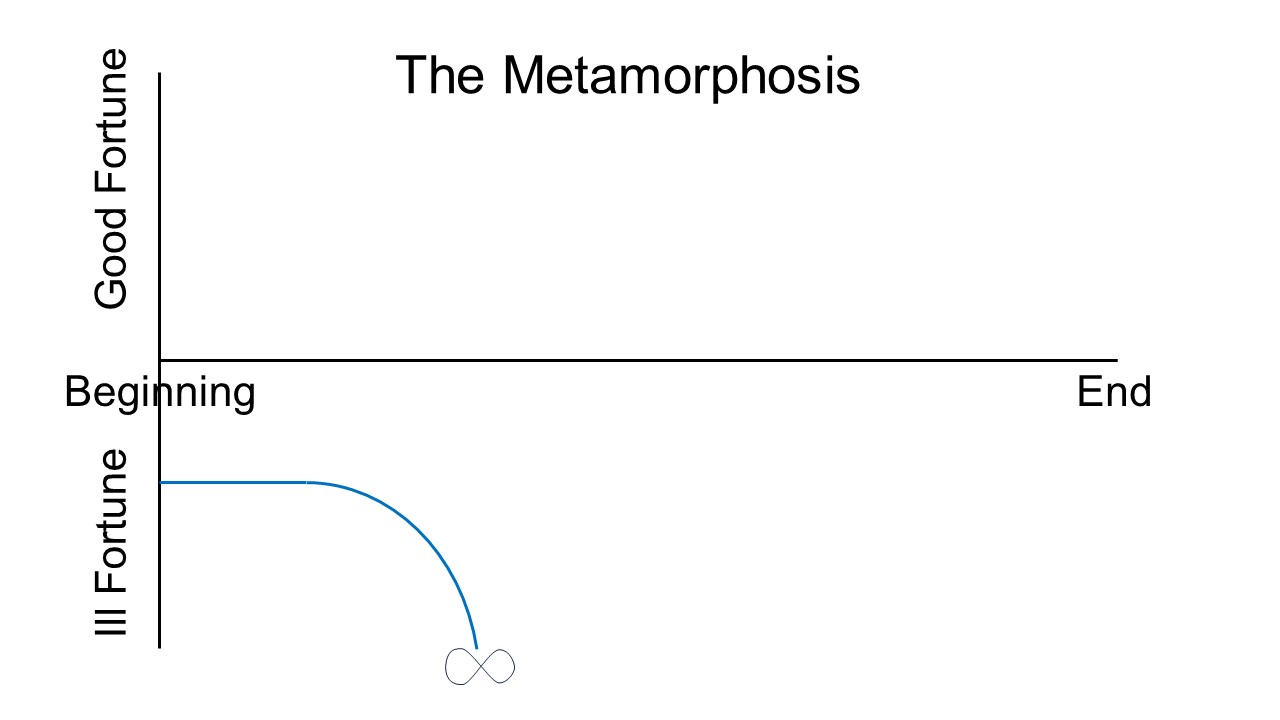
His lecture covers several basic story types illustrating a protagonist’s experiences of good or ill fortune as ups and downs on the graph. If the author writes well, the reader will feel uplifted during the ‘good fortune’ periods and sad during the ‘ill fortune’ portions.
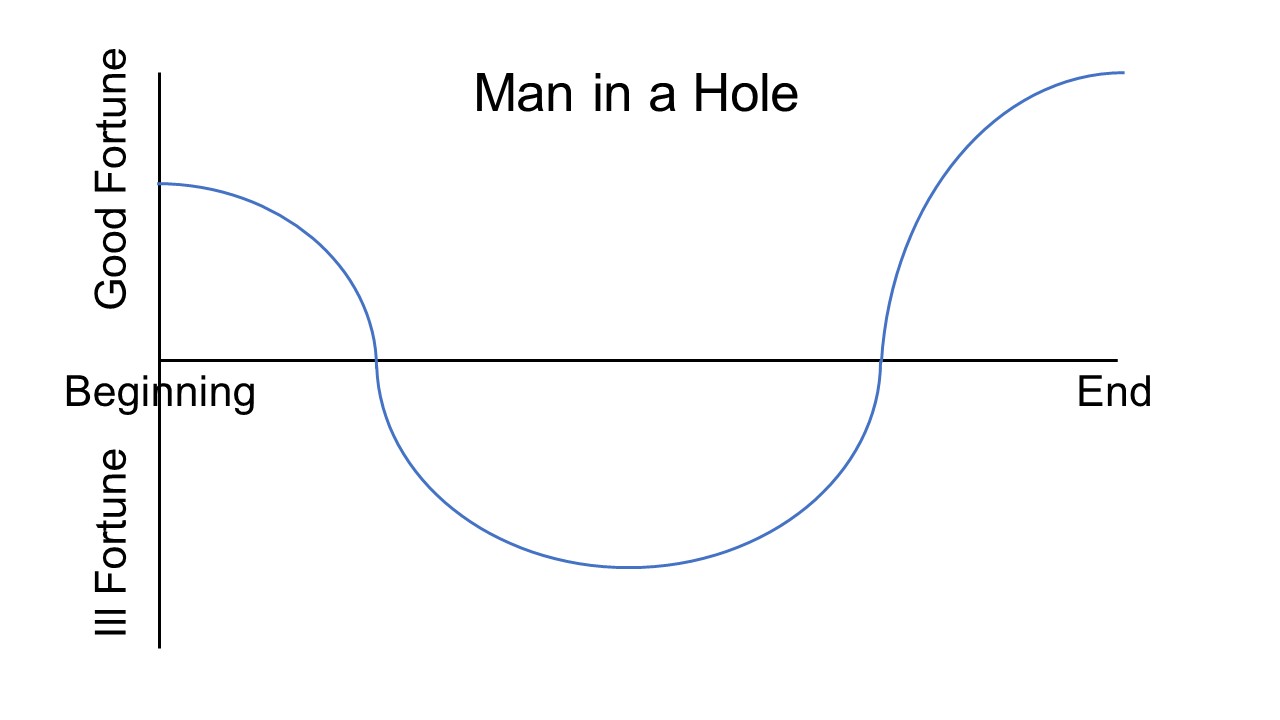
The main story types Vonnegut presents in his lecture are ‘Man in a Hole,’ ‘Boy Meets Girl,’ ‘Cinderella,’ and ‘Metamorphosis.’ Watch the video to hear his descriptions of each one.
Vonnegut comments that we humans often struggle to recognize and appreciate times of good fortune in our own lives. Therefore, I think, we often experience, and can relate to, the uncertainty of Hamlet.
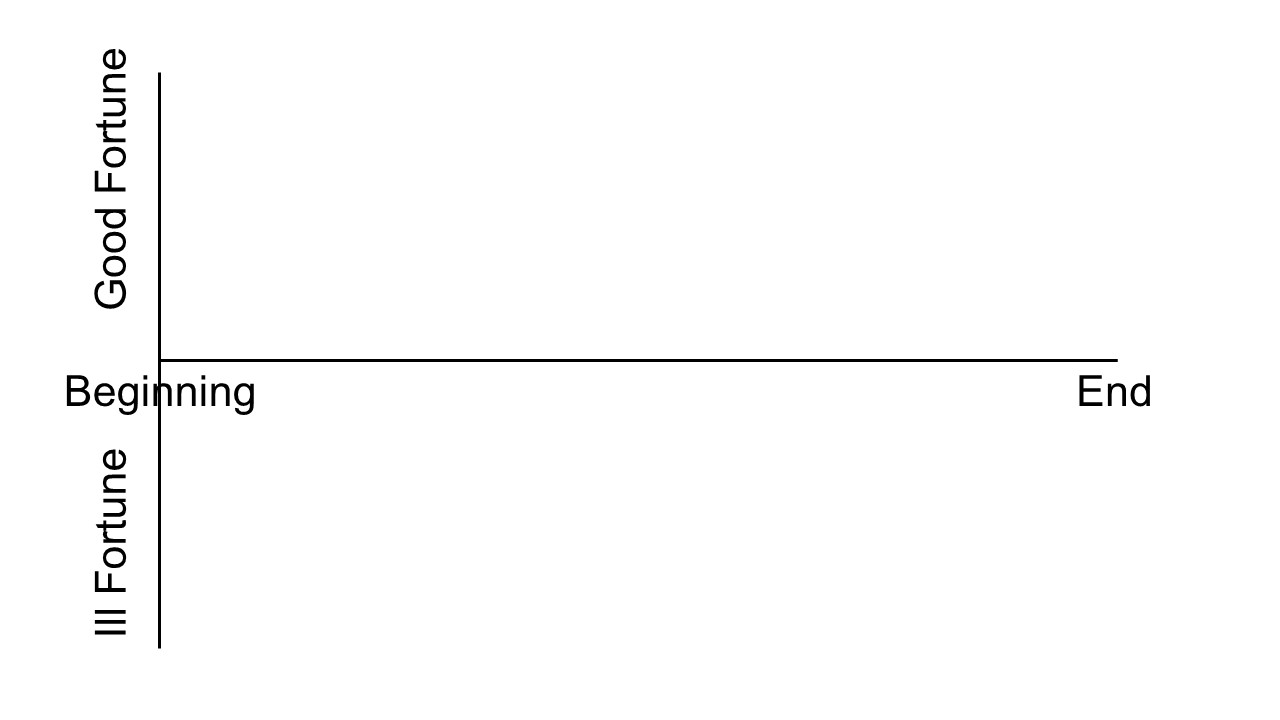
Then Vonnegut’s system breaks down. He tries to illustrate Shakespeare’s ‘Hamlet’ and ends up drawing a boring, straight line. Since Hamlet doesn’t know if the ghost he’s seeing is real, or significant, he spends much of the play in a state of uncertainty, not knowing if he’s experiencing good fortune or ill fortune.
Still, it is possible to depict uncertainty on a graph. Scientists use error bands, often shown as shaded areas.
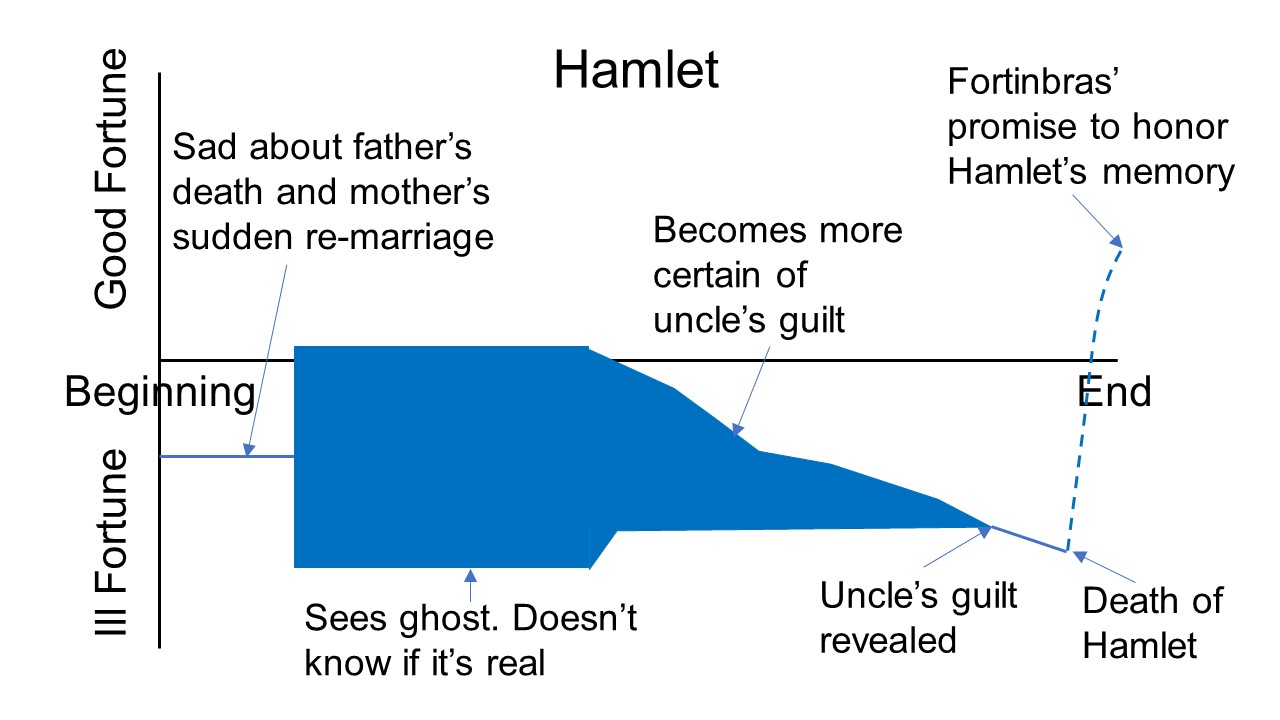
My graph is one possible way to depict the uncertainty faced by Hamlet. In general, readers don’t like uncertain characters or vagueness about their state of mind. If a character doesn’t know if her life is good or bad at a given moment, the reader could dismiss her as being stupid.
With a skilled writer, like Shakespeare, however, we understand Hamlet’s confusion and sympathize with him. We don’t think he’s dimwitted or insane, despite his attempts to feign madness.
You can depict uncertainty on a Vonnegut-style story graph. In fact, I think the entire mystery genre involves uncertainty to some extent. For much of these stories, the detective can’t tell if a given clue gets her closer to solving the case or not. The detective strives to diminish uncertainty until the end.
I’ll leave you with one more observation about Vonnegut’s graphs. I don’t believe the ones he covered in his lecture constitute the only possible graphs, and I think he would have agreed. Story graphs may take any shape, but some (the ones he showed) work better with readers than others.
In the end, it’s the writing that matters. It’s how you convey the emotional highs and lows to the reader that counts. If you tell a good story, you can make almost any graph shape work.
This concludes your combined Math and Language Arts classes for the day, thanks to your favorite professor—
Poseidon’s Scribe