That adage about a picture being worth a thousand words really resonates with me. I like pictures and diagrams. It would be great to capture the structure of a story plot with a picture, wouldn’t it?
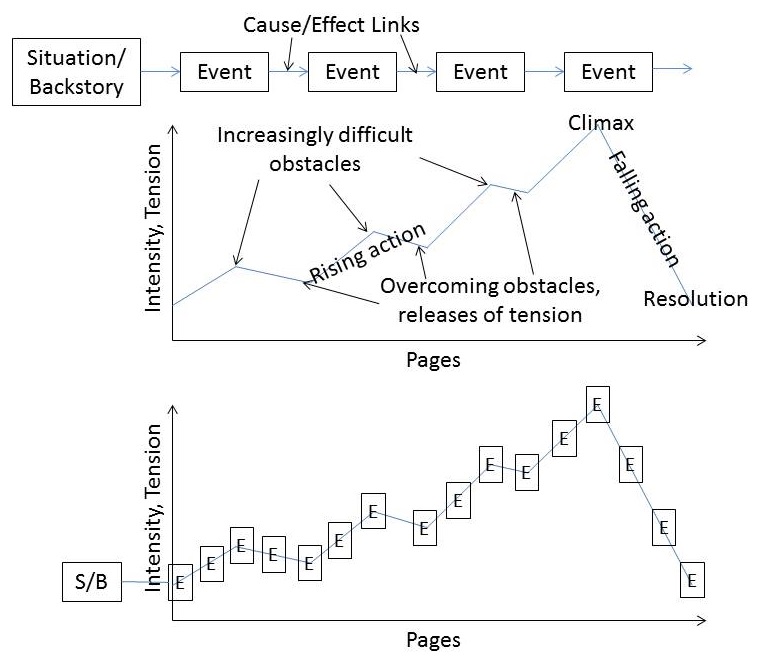
Luckily, I don’t have to invent one. That’s been done. And redone and redone. Search the web for “plot arcs” and you’ll see many, many ways to depict story plots. I even offered my own picture here.
Today I’ll pick a few representative plot arcs and discuss how they’ve changed through time. First, let me introduce various writers who analyzed plots and came up with their own terms for the various events and phases of a story:
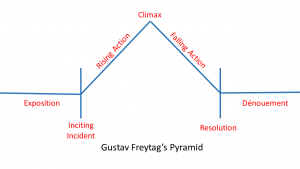
- Gustav Freytag: Exposition, Inciting Incident/Complication, Rising Action, Climax, Falling Action, Resolution, Dénouement
- Mark Flanagan: Exposition, Rising Action, Climax, Falling Action, Resolution
- Nigel Watts: Stasis, Trigger, The quest, Surprise, Critical choice, Climax, Reversal, Resolution
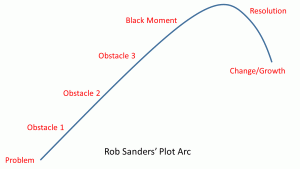
- Rob Sanders: Problem, Obstacle 1, Obstacle 2, Obstacle 3, Black Moment, Resolution, Change/Growth
- H.R. D’Costa: Inciting Incident, First Act Break (25%), Midpoint, Point of Commitment, All Is Lost (75%), Climax, Resolution (applicable to movies)
As you can see, different people use different terms. I’ve tried to line them up in the following chart:
| Gustav Freytag | Mark Flanagan | Nigel Watts | Rob Sanders | H.R. D’Costa |
| Exposition | Exposition | Stasis | ||
| Inciting Incident/ Complication | Trigger | Problem | Inciting Incident | |
| Rising Action | Rising Action | The quest | Obstacle 1 | First Act Break (25%) |
| Surprise | Obstacle 2 | Midpoint (50%) | ||
| Critical Choice | Obstacle 3 | Point of Commitment | ||
| Black Moment | All is Lost (75%) | |||
| Climax | Climax | Climax | Climax | |
| Falling Action | Falling Action | Reversal | ||
| Resolution | Resolution | Resolution | Resolution | Resolution |
| Dénouement | Change/Growth |
It’s a rough alignment, I admit. What I find interesting is the shift from the way Gustav Freytag depicted the plot arc (his is termed a plot pyramid).
 Note the symmetry. That’s what he was trying to illustrate, that exposition is the counterpart of dénouement, inciting incident is the counterpart to resolution, and so on. His pyramid clearly depicts which terms refer to specific events, and which to time periods.
The weakness of Freytag’s arc is that it might lead a writer to believe these are equal chunks of time (if time is the horizontal (‘x’) axis. More, if Freytag meant for the vertical (‘y’) axis to represent excitement or tension, is it true that the story comes all the way back down to the low excitement of the beginning?
Modern attempts to correct these weaknesses are typified by this diagram of Rob Sanders’s plot arc.
 Note the shift to the right, indicating that you want to conclude the story rapidly after the peak of the action. Most of the time in the story is spent increasing the tension with a succession of obstacles. After the peak, end things quickly.
Also, note that the arc does not return all the way down to the same low level of tension and excitement present at the story’s beginning.
Finally, note the absence of any Exposition. The arc starts with a problem. Bang. No introduction of characters or explanation of their backgrounds. Today, authors hook the reader with a problem right away, and catch up with descriptions and backstory later, either through flashbacks or inference, or working it in via dialogue or character thoughts.
My advice is not to fixate on plot diagrams. Get the general idea of how plots work, then write your story. True, the best stories do adhere to these diagrams closely, but I’m betting the greatest authors didn’t spend much time drawing plot arcs.
A picture (of a plot arc) may well be worth a thousand words, but you’re a writer. Write the thousand words, sez:
Poseidon’s Scribe

