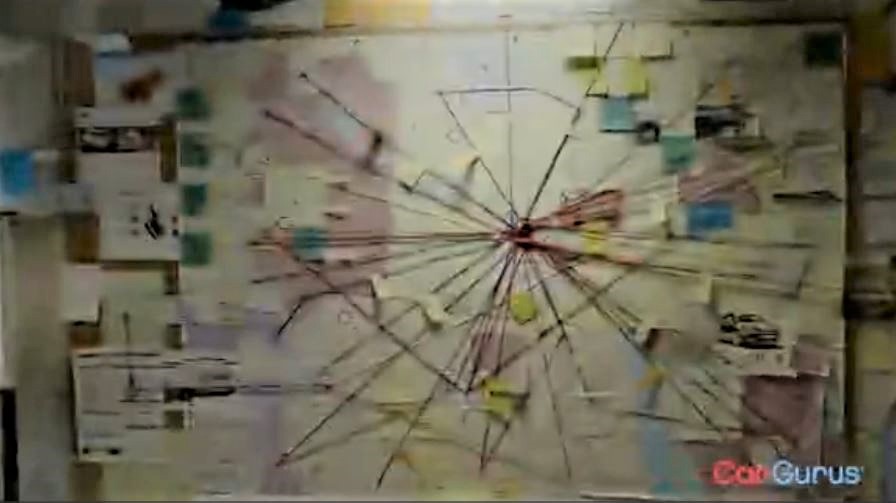
Link charts—I know you’ve seen them. Big, poster-size charts with pictures and words, arrows and colored threads connecting things. Complex, but visually stunning. Could you use one to write your novel?
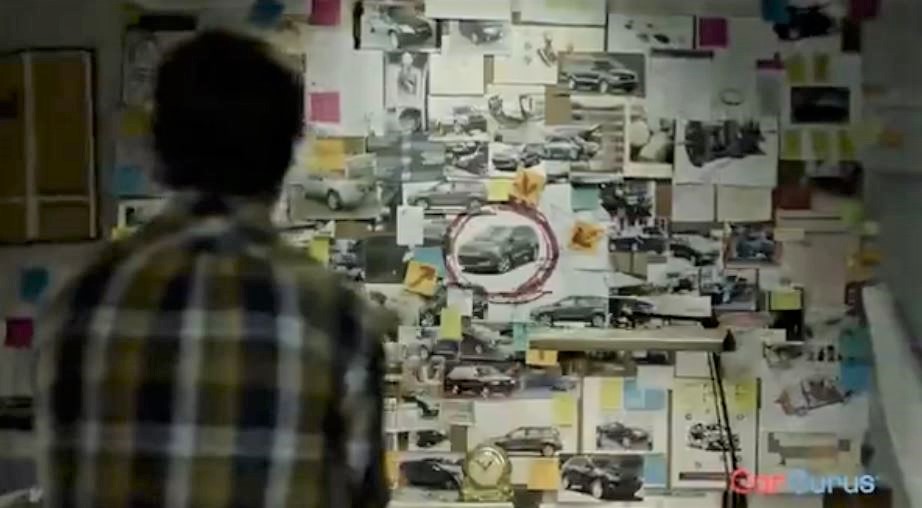
You’ve seen link charts on shows featuring detectives and others with basement conspiracy theorists. You may have seen two of them on a TV ad for CarGurus. Note: I’m neither endorsing nor disparaging CarGurus.
From what I understand, real-life detectives rarely, if ever, use link charts. But TV and movie detectives do, for two simple reasons. Link charts convey, in one picture, that the detective’s done a lot of work, and they show, at a single glance, a lot of relationships between people and things. They make for a great visual in a visual medium.
That second property may prove useful to you. If you’re writing a novel, you’re keeping track of many characters, settings, events, etc. To organize that data, you most likely think like a writer and write it all down—on sticky notes, index cards, notepaper in three-ring binders, computer files, online wikis, etc. You waste considerable time wading through your files to track down something you half-remember writing months ago.
At such times, you might wish you could have it all handy, in one place. A link chart might help. You’ve seen TV sleuths stare at their charts and snap their fingers, and you know they’ve just solved the case. Staring at a big picture of your novel might aid you, too.
Some years ago, I learned some of the data visualization principles espoused by Edward Tufte. He advocates data-rich illustrations that present all the data. Often these get very complex, but backing up from their complexity, a viewer discerns patterns, relationships, and trends. Tufte’s illustrations represent gestalts, greater than the sum of their parts.
I don’t know what Tufte would make of link charts in particular, but a well-made link chart can satisfy Tufte’s principles of visually representing data.
How might you set up a link chart for the novel you’re writing? Here are some ideas:
- A character relationship map
- A character motivation chart
- A plot outline tying the settings to the characters to the events
- A motive-means-opportunity chart relating all suspects to a murder, if you’re writing a murder novel
In the CarGurus TV commercial, the woman knows a quicker way for the man to get the car he wants, implying the link charts just wasted his time. However, until someone comes up with a NovelGuru app that writes a novel for you (c’mon, app developers, get on that!), a link chart might prove beneficial.
If you do develop your own link chart, consider hiding it so nobody else sees the thing without you being present to explain it. Someone happening upon your link chart might suspect you’re hunting for Big Foot, correlating UFO sightings, or planning a real-life murder.
Unless, of course, you’d rather have them think you’re doing those things, than writing a novel!
Whatever link chart you make, do not connect any threads between Big Foot, UFOs, or murders to—
Poseidon’s Scribe
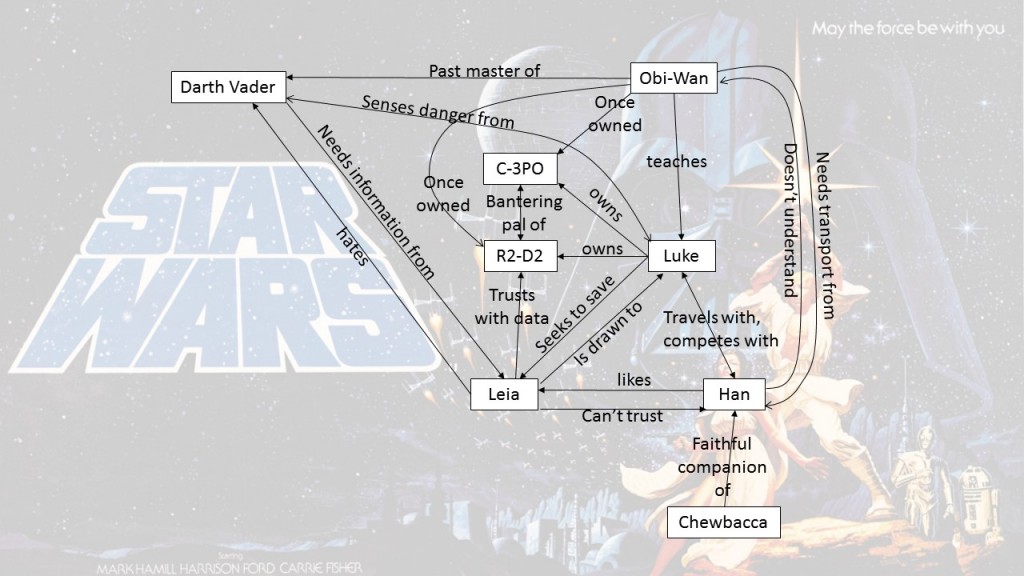 The one I’m showing here, for the first Star Wars movie, A New Hope (Episode IV), is for illustrative purposes only and is not complete or necessarily accurate. My only intent is to show one possible example for a case familiar to most readers. To see many other sample Character Relationship Maps, do an Internet search for that term and click on images.